Radar Data Availability Figures

These are some useful figures showing airborne radar sounder data availability and survey density for the Antarctic and Greenland ice sheets, using data from xOPR and BedMap catalogs, supplemented with flight tracks published directly by AWI and the KOPRI/UTIG helicopter surveys. Generated automatically on each push to main.

For more details on the data density maps, see this blog post.

See the code to generate these figures on GitHub.

Combined Data Availability

Combined data availability
Combined BedMap + xOPR data availability by year, using some loose heuristics for combining the two catalogs.
uv run python plot_combined_availability.py
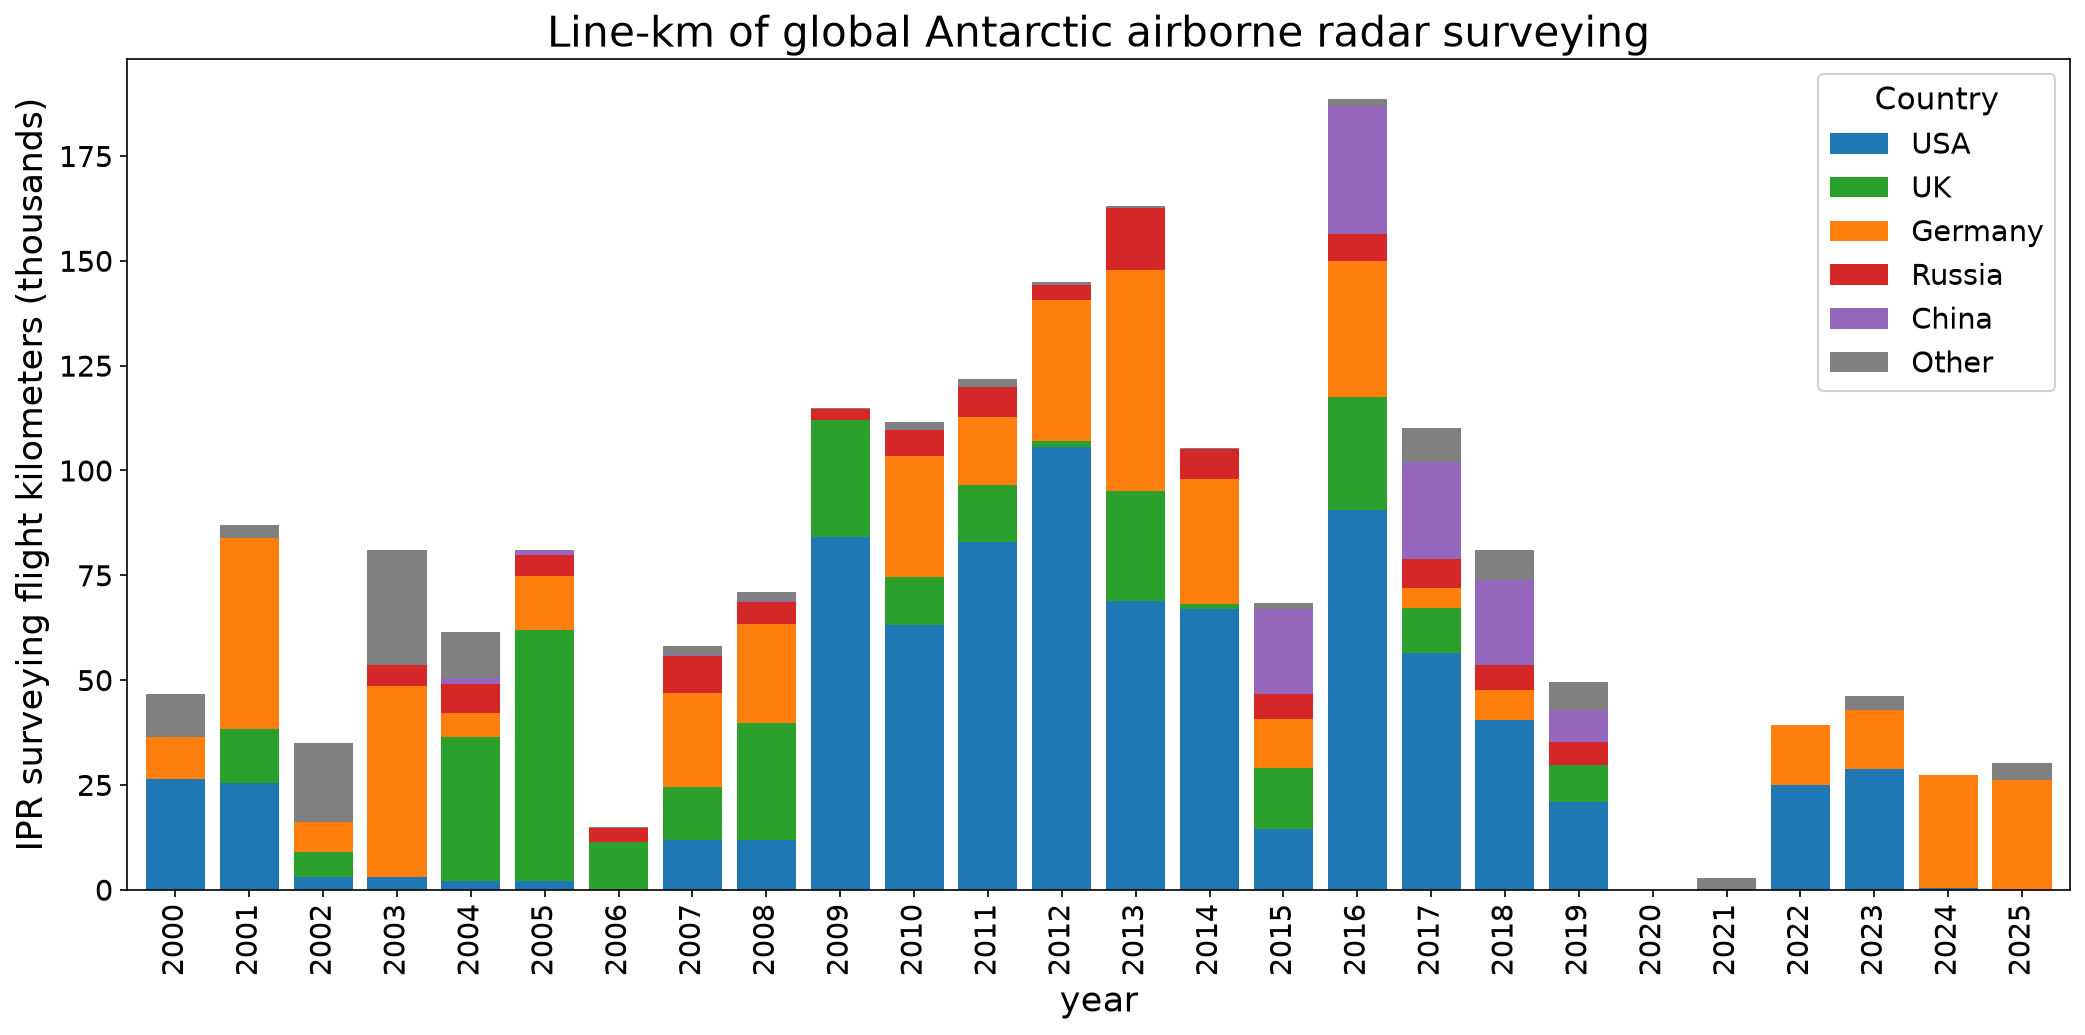
Antarctic Airborne Radar Surveying by Country

Antarctic airborne radar line-km per year by country
Line-km of Antarctic airborne radar sounding per year, stacked by the country of the collecting institution. BedMap campaigns are spread over their catalog date range; the AWI, KOPRI and xOPR-sourced tracks are placed in their field season.
uv run python plot_bedmap_availability.py

Survey Density: BedMap Antarctica

BedMap Antarctica survey density
Survey density from BedMap 1, 2, and 3(Antarctica)
uv run python plot_survey_density.py --source bedmap_local --region antarctica

Survey Density: BedMap Antarctica (Amundsen Sea Embayment)

BedMap ASE survey density
Same density map as above, zoomed to the Amundsen Sea Embayment
uv run python plot_survey_density.py --source bedmap_local --region antarctica --zoom ase

Survey Density: xOPR Greenland

xOPR Greenland survey density
Survey density from radar sounder data available through xOPR (Greenland)
uv run python plot_survey_density.py --source xopr --region greenland