Benchmark results
Cost and runtime of the zagg compute pipeline on AWS Lambda, tracked per merge to
main (issue #110). Each point dispatches the single densest shard over the
NEON SERC AOP box — arm64, 2 GB, one shard per target, capped by the 720 s deploy
timeout — so deltas track code changes, not data drift.
The charts below are rendered on every merge and published to the benchmarks
data branch; they update live (the docs embed them by raw URL, so no docs rebuild
is needed). See Lambda benchmark CI/CD setup for how the
pipeline is wired.
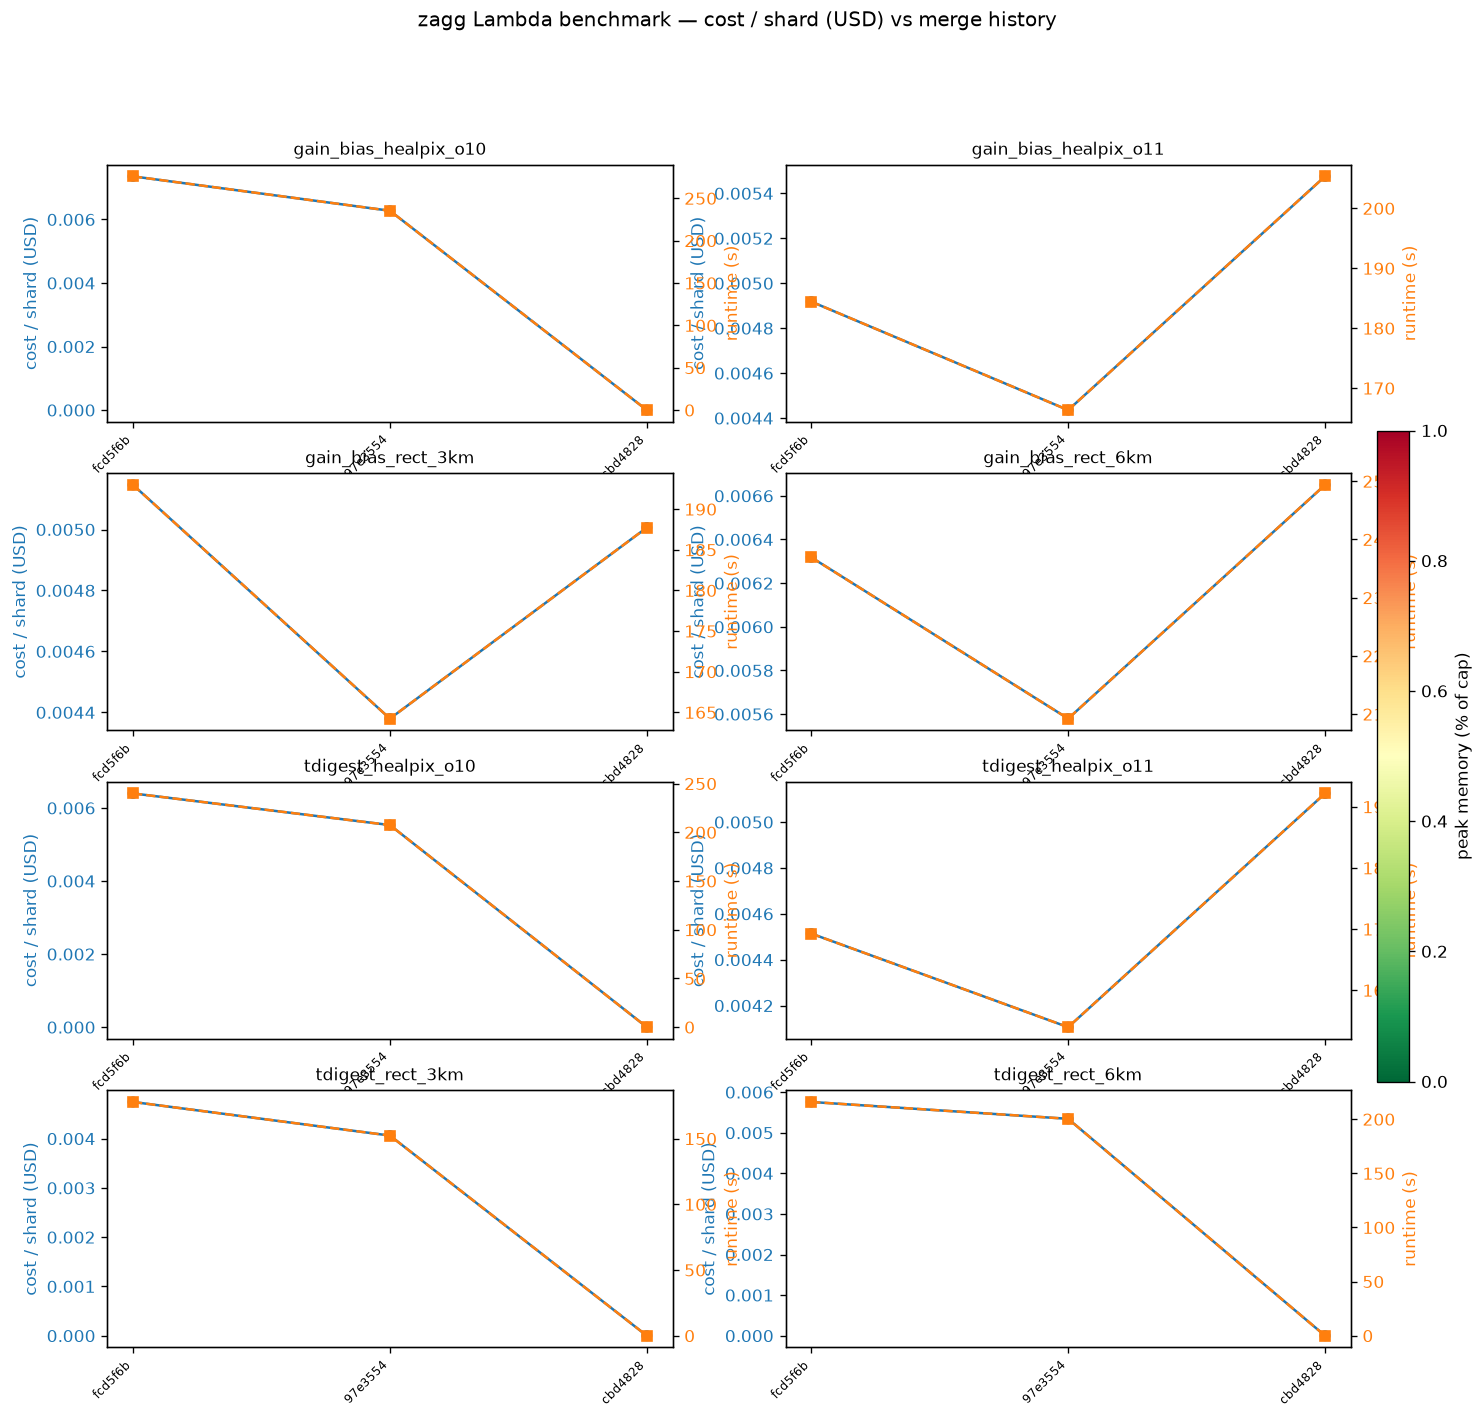
Cost per shard vs runtime
Cost per 100 km² vs runtime
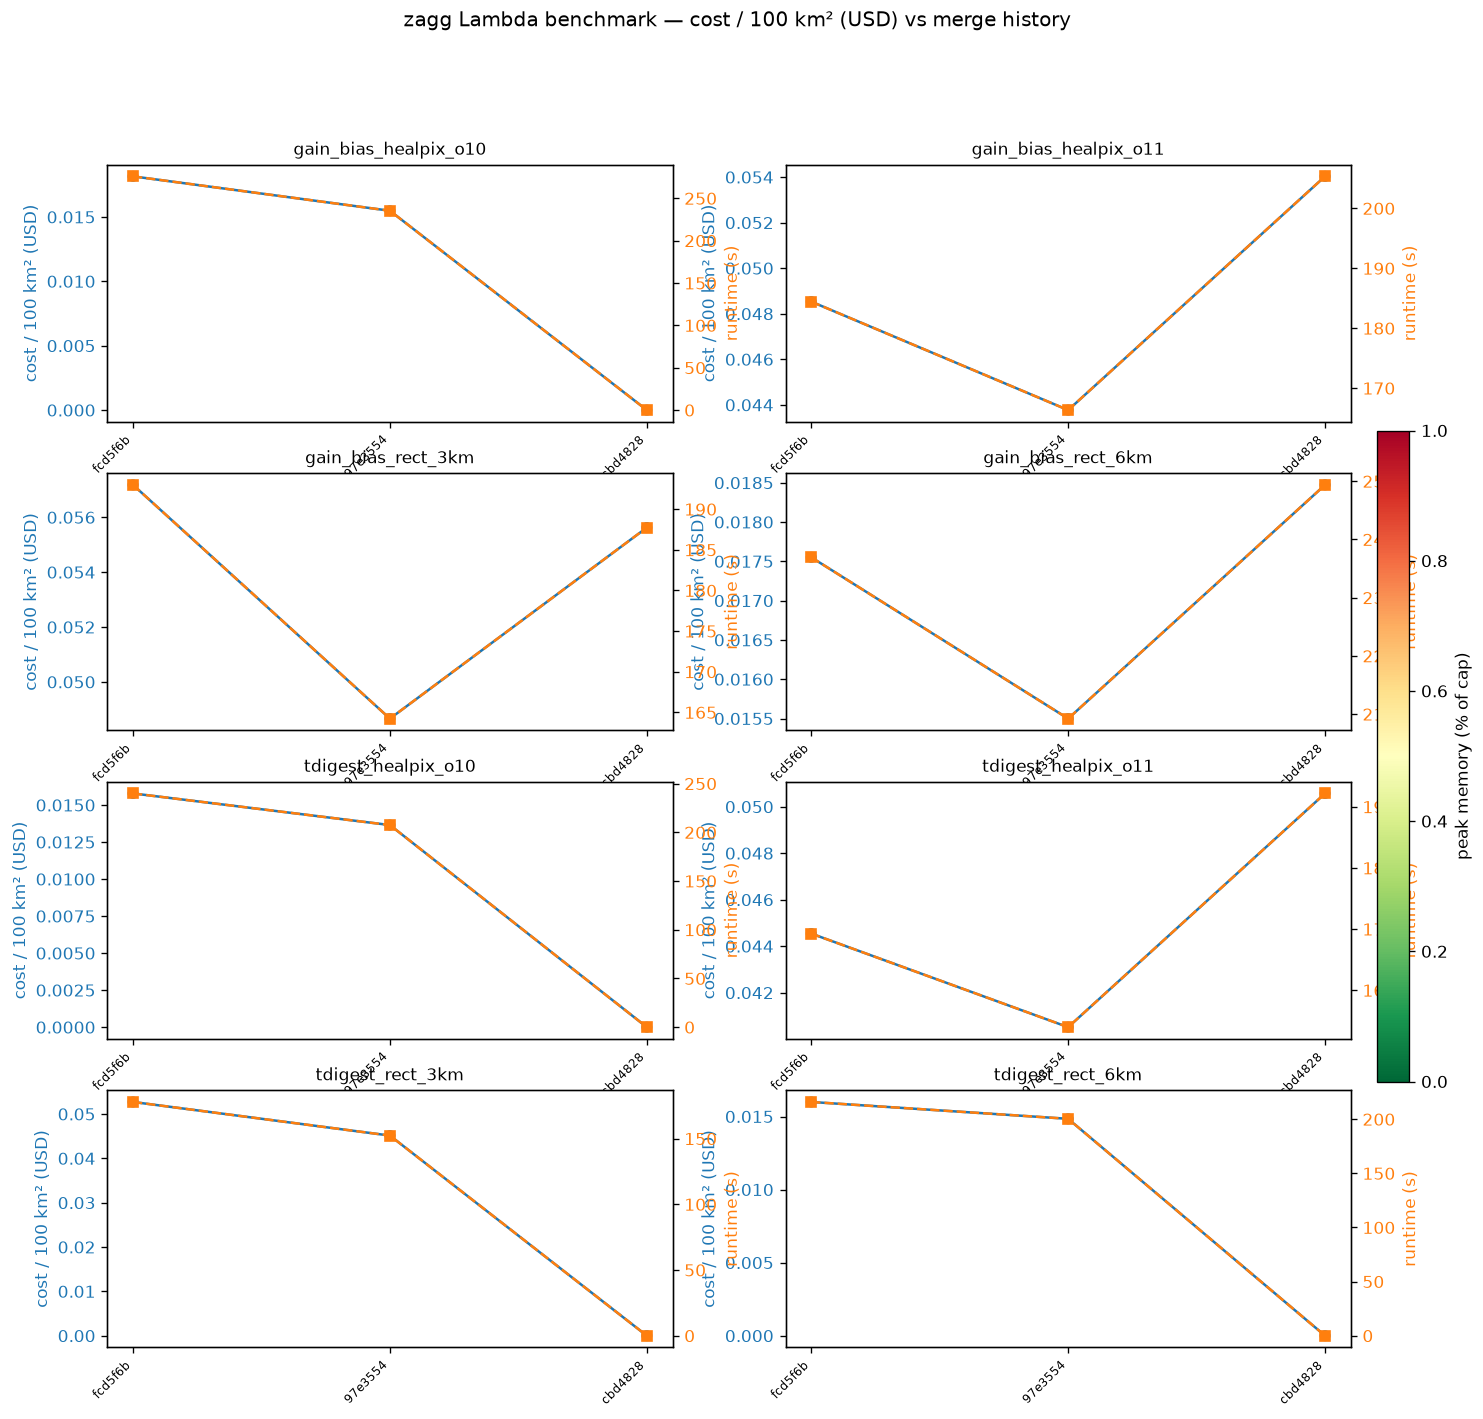
Per-target panels show cost (left axis) and Lambda runtime (right axis)
over merge history, for the gain/bias and t-digest aggregators at HEALPix order 11
and 10 (and the matched rectilinear grids). The full retained history lives as
series.parquet on the benchmarks branch.
If the images above are blank, the pipeline hasn't run a merge yet — they appear after the first merge to
mainonce the setup is complete.